Student guest blog post: pterosaur wings and flight capabilities
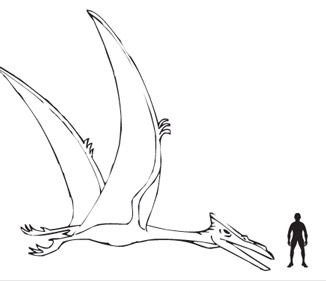
Artist's interpretation of Quetzalcoatlus northropi, with human figure for scale. (Image credit: Everything Dinosaur blog.)
This is the third guest blog post authored by students of the course on animal flight for engineers at GW. The series looks into several long-standing debates about the flight of pterosaurs.
The previous guest post addressed the problematic issue of estimating the weight of extinct animals like the pterosaurs, which have no living relatives. The largest pterosaur, Quetzalcoatlus northropi, probably weighed about 250 kg—previous estimates that gave it double that weight were based on wrong data for the body length (Henderson, 2010), while others that assigned it a wimpy 70 kg are based on wrongly applying avian features, such as bipedal launch. The anatomical evidence is more consistent with a quadrupedal launch, which was the topic of the first student guest post. In this installment, the students analyze the flight surfaces (membrane wings) and performance (speed, range, altitude).
Pterosaur wings
by Anuja Dharia and Dereck Chiu
The previous student blog post introduced pterosaur wings, noting their structural features that make them capable of sustaining the loads of these heavy-weight flyers. But it turns out that the structure of pterosaur wings has been subject to its own measure of disagreement.
Preserved specimens with soft-tissue anatomy are rare; therefore, the nature of the patagium (wing membrane) and structural fibers have been subject to debate. Various models over the years have suggested different wing shapes for pterosaurs, but currently the preferred model consists of an elastic membrane stretched from the ankles to the wing tips, seen in frame A and D of the Figure below from Elgin et al. (2011).
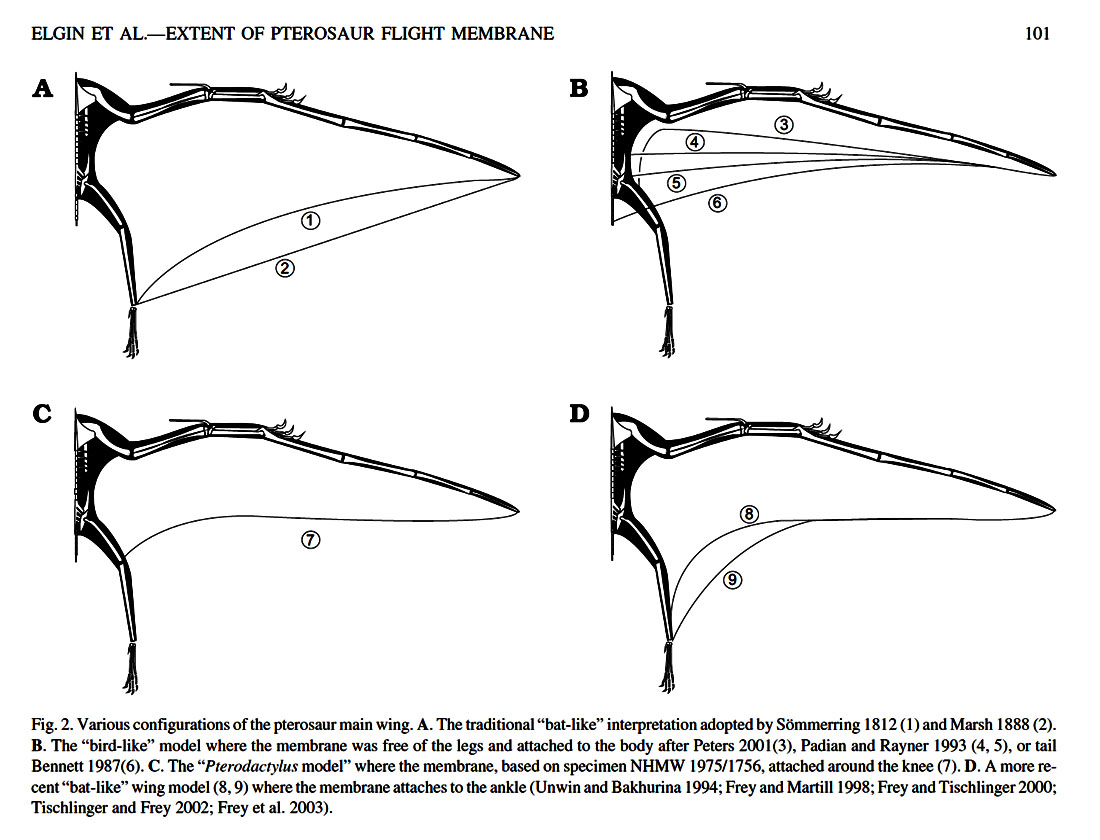
Figure 2 of Elgin et al. (2011), showing the various configurations that have been proposed for pterosaur wings. (Image inserted from URL to another blog.)
Wing configuration
In studying pterosaur wings, the following terminology is used to distinguish various regions:
- Proximal region (near the body): In the proximal region, the wing bones lay within the margins of the membrane. The propatagium is a fold of skin in front of the upper arm, forming the fore-wing near the body, attached to the shoulders. Little information regarding the propatagium has been published so far because of rare fully preserved specimens. The issue of greatest contention has been the way in which the main wing membrane (brachiopatagium) is connected to the body: at the ankles, at the knees or thighs, or at the hips. According to Elgin et al. (2011), the fossil evidence so far provides unanimous support for an ankle attachment.
- Distal region (away from the body region): The main wing membrane in the distal region was supported by wing bones situated along the margin of the wing (forming the leading edge), including a hugely elongated fourth finger.
The margin of the pterosaur wing membrane was unconstrained at the rear of the structure (trailing edge) and attached to the body at the ankle, so if we consider it from the mechanical point of view, this edge must be concave (pterosaurs do not have fingers that extend within the membrane, like bats do).
Structure of the wing membrane
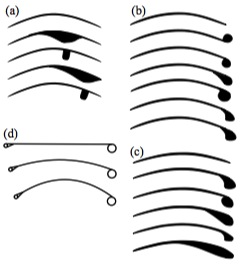
The distal wing membrane contained layers of actinofibrils, slender structural fibres that coated parts of the membrane and were arranged in a radiating pattern, with each layer in a different direction (Kellner et al., 2010). The fossil evidence indicates that these fibres were of a diameter comparable to some human hair (approx. 0.1–0.5 mm) and were probably composed of high-tensile collagenous tissue. The function of the actinofibrils was to prevent unwanted flapping of the membrane, transfer aerodynamic loads anteriorly and proximally, and spread the patagium chordwise; the last is the only one supported by data (Bennet, 2000).
Theoretical models
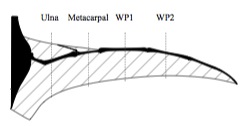
Palmer (2010) tested various sections of a theoretical pterosaur wing in a wind tunnel.
Wing sections tested by Palmer (2010).
Because of the scant fossil record of pterosaur wing membranes, researchers have looked into theoretical approaches to determine the likely shape.
Palmer (2010) tested wing models in a wind tunnel and determined that these creatures were less aerodynamically efficient and flew at lower speeds than previously thought. The wing sections were more adapted to low-speed flight, minimizing the sink rate, allowing use of the weak thermal lift found over the sea and making it less susceptible to impact damage when landing.
[Palmer himself explains his findings in a guest post at the Archosaur Musings blog.]
Palmer and Dyke (2012) conducted theoretical tests of different wing shapes to find the most aerodynamically efficient. They used an analysis software aimed at model airplanes called XFL5.
For stability, the center of mass and center of pressure need to to coincide. Model results for pterosaurs show that, to achieve this, limitations to the wing sweep and membrane morphology had to be imposed. Taking into consideration the minimum induced drag and passive static stability, a forward sweep and reflexed proximal wing section provided the most efficient theoretical wing shape.
[Edited: Palmer and Dyke used the pterosaur mass estimate of Henderson (2010), which is incorrect and much too large for Quetzalcoatlus, but suitable for the smaller animal of that study.]
References
- S.C. Bennett (2000), Pterosaur flight: The role of actinofibrils in wing function, Historical Biology, 14(4):255-284
- Elgin, R.A., D.W.E. Hone, and E. Frey (2011), The extent of the pterosaur flight membrane. Acta Palaeontologica Polonica 56(1): 99-111. doi:10.4202/app.2009.0145
- Kellner AWA, Wang X, Tischlinger H, Campos DA, Hone DWE, Meng Xi (2010) The soft tissue of Jeholopterus (Pterosauria, Anurognathidae, Batrachognathinae) and the structure of the pterosaur wing membrane. Proc Roy Soc B. 277:321–329, doi:10.1098/rspb.2009.0846
- Palmer, C. (2010), Flight in slow motion: aerodynamics of the pterosaur wing. Prob Roy Soc., 278(1713):1881-1885
- Palmer, C., and G. Dyke (2012), Constraints on the wing morphology of pterosaurs. Proc Roy Soc., 279(1731):1218-1224. http://rspb.royalsocietypublishing.org/content/279/1731/1218.full
Pterosaur flight performance
by Danielle Barsky and Colin Parker
Biomechanicist Michael Habib and paleontologist Mike Witton presented at a conference in 2010 their studies on Quetzalcoatlus northropi: they estimated that it could have flown at a maximum speed of up to 80 mph (burst speed), for 7–10 days at a time, at altitudes up to 15,000 feet (see NPR report, in the References list). Q. northropi was a huge creature (shown in green in the figure from Wikipedia, below), with a wingspan of about 10 m and estimated weight up to 250 kg. Could it really be capable of such fast, long and high-altitude flight?

Relative size of Quetzalcoatlus northropi (green) and Quetzalcoatlus sp. (blue), with a human drawn for scale. (Wikipedia Creative Commons)
According to Habib and Witton, Q. northropi could fly somewhere in the range of 8,000–12,000 miles nonstop. In order for a pterosaur to undergo such extensive migration, it relied on updrafts of warm air and wind currents, only flapped a few minutes at a time, and would glide to allow its muscles to recover. They estimated that Q. northropi would have to gain 72 kg of fat, on top of its “empty” weight of 200 kg, to use as fuel reserves for each trip. As basis for these claims, the scientists used the giant pterosaur’s wingspan and weight and a bird migration model.
Pennycuick Migration Model
Habib and Witton used a modified Pennycuick migration model, developed in 1975 for flapping flight. It became a standard for migration modeling with further studies being done to improve the accuracy for a larger variety of conditions.
Power
The first part of the Pennycuick model calculates the power required for flight. The power estimate can then be used to find optimal migration speed, which is found from a relationship between power and flight speed. The power required for flight is calculated from a combination of parasitic power, metabolic power and induced power, as follows:
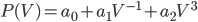
This results in a U-shaped relationship for power  vs. speed
  . From this relationship, optimal flight speeds for range, flight time, and migration time can be determined.
Soaring
When soaring is involved, the flight speed changes based on the conditions. Similarly, when up-currents of air are present, new optimal speeds can be calculated. These new speeds are a function of the rising air and reduce the energy cost in migration. It is more beneficial to large birds, which would make it possible for Q. northopi to fly long distances.
Range
The migration model obtains range calculations by estimating the fuel a bird can carry during flight. The following relationship can be used:
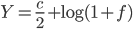
where  is the fuel load relative to the lean body mass of the bird;
  is a function of energy density of fuel, energy conversion efficiency, gravity, disk area, body frontal area, induced drag factor and body drag factor.
The more fat stores the animal can create, the further it can fly in one shot. New research has shown this to be an underestimation due to some birds’ ability to use muscle as fuel during flight. This extends the range, then upon landing the bird can quickly regenerate the lost mass. With soaring, the range can be expanded and more complex models must be used because energy loss is affected.
Current Modeling
Professor Colin Pennycuick is currently doing research to further improve the migration models. Free software using current modeling techniques is available on his website. The software, named Flight 1.24, allows a wide range of calculations to be performed for different conditions and problems—including long-distance migration, flapping and gliding flight.
Migratory Patterns of Modern Birds
In order to get a grasp of whether the claims made by Habib and Witton are reasonable, we look into the migratory patterns of modern birds.
Speed
Is the estimate of an 80-mph burst speed reasonable? According to several sources, the average flying speeds of birds range from 20 mph to 50 mph. Larger birds typically fly faster than smaller birds, and a peregrine falcon can exceed a burst speed of 100 mph when catching its prey. These numbers show that an 80-mph burst speed of the pterosaurs is possible, and its average flying speed probably fell in the higher range of 20-50 mph.
Altitude
Is 15,000-feet altitude a sensible estimate? Various studies prove that there are aerodynamic advantages to flying at high altitudes. However, at higher altitudes, less oxygen is available than at sea level. While the favored altitude for smaller birds is only 500-1000 feet, nocturnal migrants such as shorebirds fly at altitudes of 15,000 to 20,000 feet. The highest recorded altitudes are 29,000 feet. These numbers suggest that a flight altitude of 15,000 feet was possible for the pterosaurs, assuming its respiratory system could function with limited oxygen. We would still like to see additional evidence that the pterosaurs were able to reach this altitude from initial take-off level.
Range
Is a range of 8,000 miles nonstop in 7–10 days possible? (This would mean roughly 1,000 miles per day.) This was the hardest number to grasp, because estimated migratory ranges of birds don’t necessarily assume that the bird is flying nonstop.
The ranges of birds that we found included the blue-winged teal (a fast-flying duck) at 2,300–3,000 miles in a 30-day period (this would mean less than 100 miles per day). Nighthawks and barn swallows have a range of 7,000 miles, and 19 other species of birds have a range of 8,000 miles. It is unclear whether these ranges assume that the bird is flying nonstop. Of all modern birds, the average flight range is between 15 and 600 miles per day. This makes the claim of the Q. northropi flying 1000+ miles per day seem high. This number might have assumed that the average flying speed was 80 mph, although we have stated above that the average speed of the Q. northropi was probably closer to half of that speed, or 40 mph.
Another possibility is that 7–10 days indicates the total amount of flight time, rather than the total migration time. If the Q. northropi spent a few hours per day resting, the total migration time would increase, thereby decreasing the distance/time estimate.The only explanation for the ability of the pterosaurs to achieve a distance of 8,000 miles in 7–10 days would be that this creature had biological and aerodynamic advantages that allowed it to fly faster and more efficiently than modern birds. Again, we would need extra convincing that this was the case.
References
- Frazier, Reid R. “Peerless Pterosaur Could Fly Long-Distance For Days”, NPR, November 22, 2010.
- Pennycuick, C.J., Akesson, S. & Hedenstrom, A. (2013), "Air speeds of migrating birds observed by ornithodolite and compared with predictions from flight theory," Journal of the Royal Society Interface, vol 10(86):20130419 doi:10.1098/rsif.2013.0419
- Alerstam, Thomas and Hedenström, Anders. “The Development of Bird Migration Theory”, Journal of Avian Biology Vol. 29, No. 4, Optimal Migration (Dec., 1998), pp. 343-369 http://www.jstor.org/stable/3677155
- Than, Ker. “Giant Pterosaurs Could Fly 10,000 Miles Nonstop”, National Geographic, October 15, 2010
- Habib, M. (2010), 10,100 Miles: Maximum range and soaring efficiency of azhdarchid pterosaurs. J. Paleontol., SVP Program and Abstracts Book, 2010: 99A–100A. 2010.
- Habib, M. and Witton, M. Soaring efficiency and long distance travel in giant pterosaurs. Acta Geoscientica Sinica. 31(S1):27-28 // download PDF